 Blog Post
 In part 1 of this series, we discussed the challenges of audience segmentation using Google Analytics 4 (GA4) data. In part 2, we will discuss the solutions to these challenges. In doing so, we detail the novel approach used in our submission to Google’s open-source Marketing Analytics Jumpstart.
Solutions
We don’t know how many segments we need or how many will be useful.
We can think of this as a model optimization problem where we’d want to tune hyper-parameters. In such a case, we can run a k-means model within a hyper-parameter optimization framework (Optuna, hyperopt, vizier).
Hyper-parameters for k-means could be:
- Number of clusters
- Number of iterations
- Tolerance
The evaluation metrics could be:
- Silhouette score
- Mean Squared Distance
- Davies–Bouldin Index (DBI)
However, optimization for only one of those metrics might have some side effects. Usually, the more clusters there are the better the metric score. As clusters get smaller, usually they are more cohesive and better separated, so our optimization would likely return a very high number of clusters as our best choice.
Most of the time, we prefer a small number of clusters because they are easier to explain, and there is typically less business value in having many small niche clusters. Enter multi-objective optimization.
An interesting approach is to have two optimizing criteria:
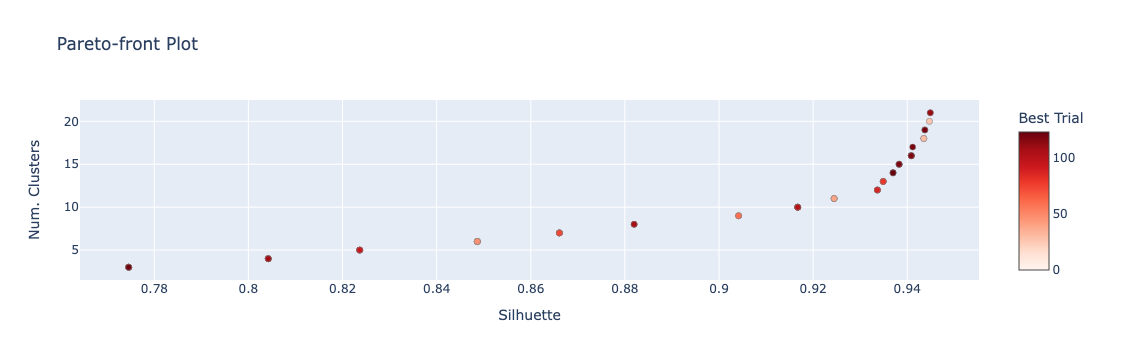
- Maximize the evaluation metric, such as the Silhouette score
- Minimize the number of clusters
That way, we are trying to get better clusters (by evaluation metric), but at the same time, we have as few of them as are still viable.
Multi-objective optimization does not return one best solution but a Pareto front of best solutions. From there, we still have to pick one to go with. However, now we have an excellent view of what the best evaluation metric is for each number of clusters. We could have a heuristic saying, “Take the model with the number of clusters equal to X, but that model shouldn’t be worse than Y% from the best-scored model based on the evaluation metric.”
It’s like saying we don’t need the best model because it also comes with many clusters that may not be relevant, so we are willing to trade a little bit of performance for a smaller number of clusters.
The multi-objective optimization can be freely expanded into even more optimization targets. You should have as evenly sized clusters as possible. If so, use the Gini coefficient to measure the size inequality and minimize it.
It could get even more interesting if the optimization process includes feature selection, meaning you want to select only features that generate the best possible results. When optimizing for feature selection, you don’t want to drop many of them, so you might also consider optimizing to maximize the share of features used.
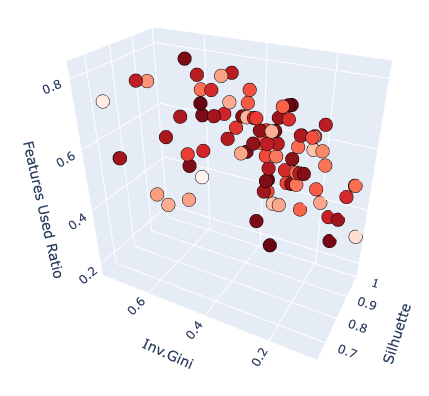
Result of the multi-objective optimization. Three optimization targets produce a 3D Pareto-front.
Once you have the segments, they need meaningful business names.
There is no automated naming solution (yet), so you will still need human intervention to come up with names.
One interesting alternative worth exploring would be using Large Language Models (LLMs) to recommend name ideas based on the cluster centroids given. Eventually, this could also be automated.
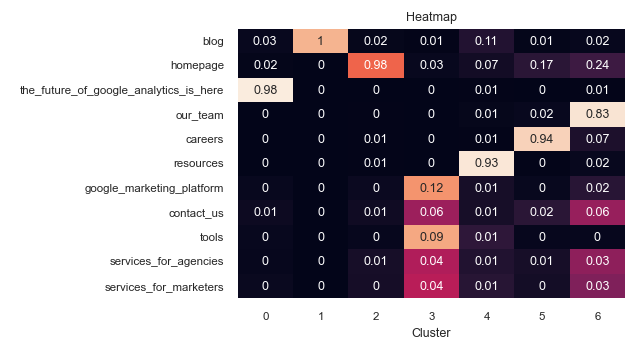
Segments need to be explainable.
The easiest way to make segments explainable is to reduce the number of attributes and make them of the same ‘domain.’ Even as low as — or below — 10 attributes can make a world of difference, making it easy to understand what is happening.
Reducing the number of attributes is usually relatively easy if you pick a direction (or ‘domain’) you want to cluster on. Some examples:
- Interest
- Possible features: product categories visited
- Engagement
- Possible features: time on site, number of page views, number of visits, frequency of visits
- Sales funnel stage
- Possible features: Key steps of the funnel visited (add to cart, checkout, product page visit, purchase)
You can always cluster on those separately and still slice and dice different segments from different models. In other words, by not throwing everything into one model but separating it into different models, we retain all possibilities, likely with better explainability and flexibility.
Consider our example from the beginning. We want to come up with segments based on interest. How do we develop attributes for such a model with GA4 data? Typically, websites have a structured way of setting up URLs (page paths). This means that, in most cases, we can extract at least a product category from the page path and use the number of times someone has visited that product category as an attribute.
An example:
Visitor 1
/womens/running/shoes ~ 1x
/womens/tops-and-t-shirts ~ 4x
/accessories/basketballs ~ 8x
Features:
running_shoes: 1; tops_and_t_shirts: 4; basketballs: 8
Visitor 2
/womens/tops-and-t-shirts ~ 1x
/accessories/basketballs ~ 2x
Features:
running_shoes: 0; tops_and_t_shirts: 1; basketballs: 2
Engagement-wise, those two visitors are very different. One has 13 page views, and the other only three. Interest-wise, though, they seem very similar and should likely be in the same segment.
We also don’t know which one of those product categories is more visited in general, which may mean that going there often isn’t an expression of interest because most visitors go there, too. Or, some product categories might be visited very sparsely, so going to those is a much bigger expression of interest.
To solve the product category importance issue, we can use a preprocessing technique called TF-IDF, often used for word importance in text retrieval. We just need to pretend each product category is a word, and each visitor is a document (as in containing words). The process will weight each category accordingly based on the frequency of its visitations.
And to ensure both visitors end up in the same cluster, we should neutralize their engagement levels. We can accomplish this by using cosine distance as the similarity metric instead of the classic Euclidean distance. We could also address it by normalizing each visitor’s vector to have a distance of 1 (L2 normalization) and still using the Euclidean distance. Both ways assume a k-means clustering model, though it would also work with other similarity-based models.
Retraining the model might generate different segments.
This is addressed by ensuring random seeds in the code are appropriately set, meaning each run will produce the same outcomes. This might not be perfect if data changes quickly or a new model is retrained on data that doesn’t overlap well with the model’s initial training. Either way, setting a random seed is always recommended.
Another solution would be to use the prior model’s centroids as starting points for the new model. Essentially, this mimics a continuous learning process where the start of a new model’s training is exactly where the old model’s centroids were. Together with the random seed, it ensures that the segments won’t change dramatically with each retrain.
This solution also opens up an opportunity for efficient model monitoring. When each model is trained, you can easily measure the difference between centroids from one model to the next. Once large enough, this model drift could become a trigger to redefine the clusters or train a completely new model.
Conclusion
We can imagine having a well-done clustering model that would include training and prediction pipelines and could run continuously by implementing the ideas discussed here. We can also implement model monitoring to detect better when fresh retraining is needed instead of continuous training.
Ultimately, you can deliver solid segments to the GMP for activation purposes, so the great data science work doesn’t just stay within the warehouse but can be used and acted upon in your campaigns.
Questions? Want to learn more? Contact us to start the conversation.